Policy BriefHBMR-2026-001 · v1.0
The Frontline Crisis
A data-driven analysis of the behavioral health workforce collapse, turnover economics, and the cascading impact on America’s most vulnerable populations.
Suggested citation
HealthBook ME. (2026). The Frontline Crisis: A Data-Driven Analysis of the Behavioral Health Workforce Collapse, Turnover Economics, and the Cascading Impact on America’s Most Vulnerable Populations (Research Report HBMR-2026-001, Version 1.0). HealthBook ME Research & Insights. https://healthbookme.com/research/insights/frontline-crisis
DOI: to be assigned
A Data-Driven Analysis of the Behavioral Health Workforce Collapse, Turnover Economics, and the Cascading Impact on America's Most Vulnerable Populations
Prepared for: Policy Makers, Agency Directors, Grant Funders, and Human Services Leadership
Date: June 2026
Classification: Public Policy Brief — Evidence-Based Research Synthesis
EXECUTIVE SUMMARY
The United States faces a structural crisis in its frontline behavioral health and human services workforce that threatens the stability of the entire social safety net. Four interconnected forces—an inaccessible behavioral health infrastructure, catastrophic workforce turnover, unchecked secondary traumatic stress among peer specialists, and crushing caseloads that destroy client outcomes—have converged to create a system that is failing both the workers who sustain it and the vulnerable Americans who depend on it.
This whitepaper synthesizes the most recent federal and peer-reviewed data to demonstrate that:
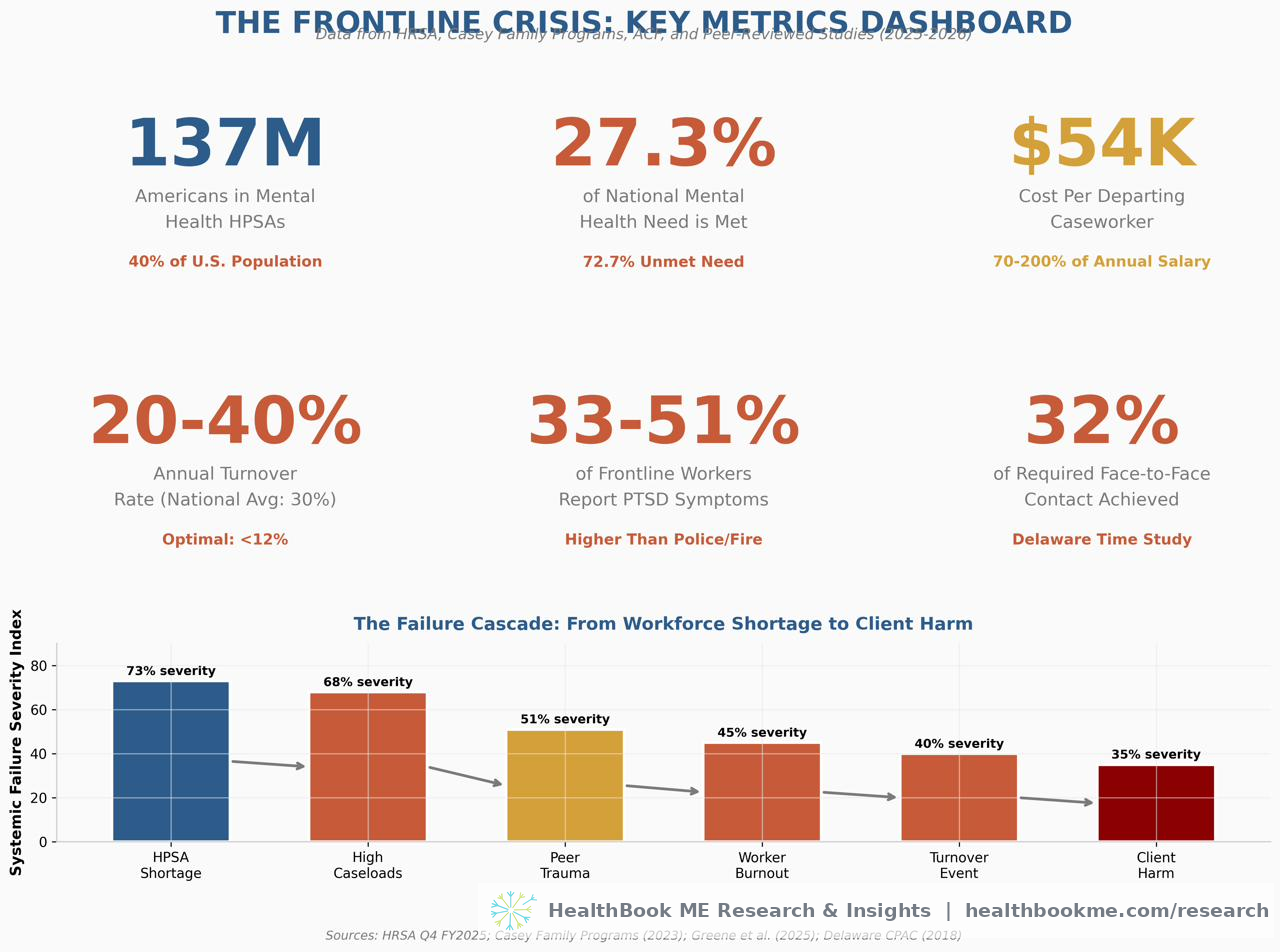
- 137 million Americans—40% of the U.S. population—live in federally designated Mental Health Professional Shortage Areas (HPSAs), where only 27.3% of mental health need is met.
- Frontline caseworker turnover persists at 20–40% annually, with each departing worker costing agencies approximately $54,000 in direct and indirect replacement costs.
- Peer support specialists with lived experience face near-universal occupational trauma exposure, with qualitative and quantitative studies documenting how client trauma stories trigger unprocessed personal trauma, producing PTSD-level symptoms in 33–51% of frontline workers (33% in U.S. shelter staff; the upper end drawn from clearly-labeled Canadian and Australian comparison studies).
- High caseloads reduce essential face-to-face client contact to less than one-third of best-practice standards, directly correlating with increased placement disruptions, re-entries into care, and systemic failures.
The core evidence presented herein is drawn from U.S. federal agencies (HRSA, ACF, SAMHSA), peer-reviewed American academic journals, and leading U.S. child welfare and behavioral health research organizations. Where directly comparable U.S. data on frontline-worker trauma is limited, the paper draws on international studies (Canadian and Australian) explicitly labeled as comparison context. The data is current as of 2025–2026 and is suitable for citation in grant applications, policy briefs, and legislative testimony.
KEY METRICS AT A GLANCE
SECTION I: THE BEHAVIORAL HEALTH WORKFORCE DEFICIT
When the Safety Net Doesn't Exist
1.1 The Scale of the Shortage
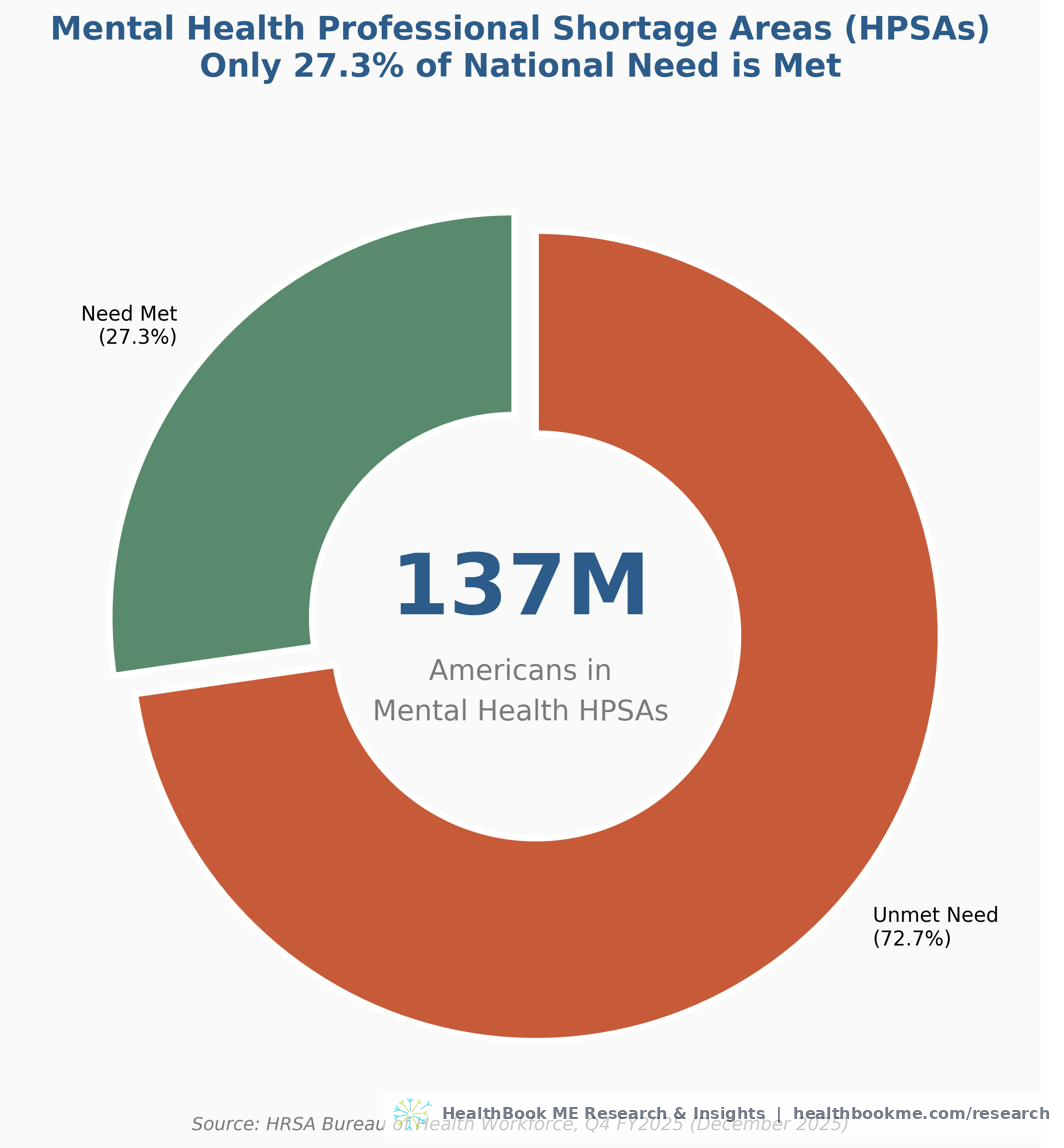
As of December 2, 2025, the Health Resources and Services Administration (HRSA) confirmed that 137 million Americans—approximately 40% of the U.S. population—live in a federally designated Mental Health Professional Shortage Area (Mental Health HPSA) (HRSA, 2025a). This is not a projection. This is a real-time federal designation updated quarterly based on population-to-provider ratios that meet or exceed statutory thresholds.
The most recent HRSA HPSA Quarterly Report (data as of December 31, 2025) documents:
| Metric | Value |
|---|---|
| Total Mental Health HPSA Designations | 6,807 |
| Population Living in Mental Health HPSAs | ~137,000,000 |
| Percent of National Need Met (All Designations) | 27.3% |
| Percent of Need Met (Population Groups) | <18% |
| Additional Practitioners Needed to Remove Designations | ~6,800 |
Source: HRSA Bureau of Health Workforce, "Designated Health Professional Shortage Areas Statistics" (data as of December 31, 2025); HRSA, "State of the Behavioral Health Workforce, 2025." Note: the ~137M population figure and the 40%-of-population framing are HRSA's own, as stated in the 2025 workforce brief. Percent-of-need-met figures are HRSA's quarterly designation statistics; the population-group cut remains the most severe at under 18%.
The disparity is most severe for population groups—underserved communities, low-income populations, and other federally recognized vulnerable groups—where less than 18% of mental health need is being met. For geographic areas, the threshold for designation is a population-to-psychiatrist ratio of at least 30,000:1, or a population-to-core-mental-health-provider ratio of at least 9,000:1. In areas with unusually high needs, the thresholds are 20,000:1 and 6,000:1, respectively. The fact that 6,807 areas still exceed these thresholds despite these generous ratios is itself a statement of systemic failure.
1.2 The Future is Bleaker: Projected Shortages Through 2038
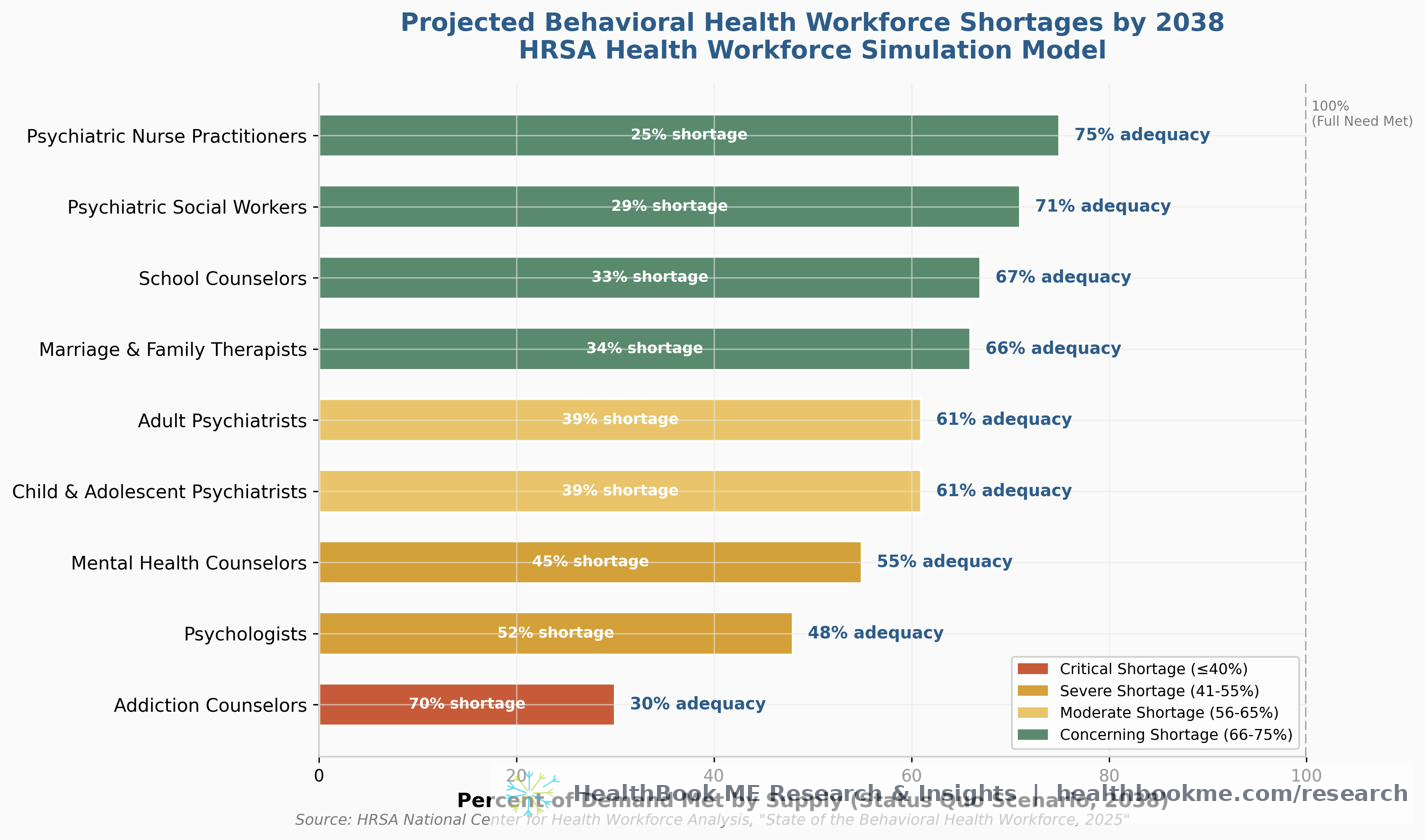
HRSA's Health Workforce Simulation Model (HWSM) projects substantial shortages across nearly every behavioral health profession by 2038. Under the baseline "Status Quo" scenario, the percent adequacy—the percentage of demand that supply will meet—is devastating:
| Profession | 2038 Percent Adequacy (Status Quo) |
|---|---|
| Addiction Counselors | 30% |
| Psychologists | 48% |
| Mental Health Counselors | 55% |
| Child & Adolescent Psychiatrists | 61% |
| Adult Psychiatrists | 61% |
| Marriage & Family Therapists | 66% |
| School Counselors | 67% |
| Psychiatric Social Workers | 71% |
| Psychiatric Nurse Practitioners | 75% |
Source: HRSA National Center for Health Workforce Analysis, "State of the Behavioral Health Workforce, 2025" (December 2025).
These projections assume no improvement in access. Under the "Elevated Need" scenario—which assumes both increased demand and improved access (i.e., more people seeking and receiving care)—the shortages become even more pronounced, as the system is not capable of absorbing increased demand.
1.3 The Rural-Urban Divide
The maldistribution of the behavioral health workforce is not merely a shortage—it is a geographic abandonment. According to HRSA's 2025 analysis, rural counties are dramatically more likely than urban counties to lack behavioral health providers entirely:
- Rural counties without psychiatric mental health nurse practitioners: Significantly higher than urban
- Rural counties without psychologists: Significantly higher than urban
- Rural counties without social workers: Significantly higher than urban
- Rural counties without counselors: Significantly higher than urban
Residents of rural counties are more likely to receive behavioral health services from primary care providers rather than specialists, and the lack of telehealth infrastructure in many rural areas further compounds the problem (HRSA, 2025a; Andrilla et al., 2022).
1.4 What This Means for Frontline Workers
For frontline human services staff—caseworkers, housing coordinators, peer specialists, shelter workers—these statistics are not abstract. They mean that the behavioral health referral network they are expected to use is, for 40% of the American population, functionally non-existent. When a caseworker identifies a client in crisis and attempts a warm handoff to a mental health provider, the wait time is not days or weeks—it is, in many cases, indefinite. The national average wait time for behavioral health services is 48 days (National Council for Mental Wellbeing, 2023), and in HPSA areas, it is often months or never.
This is not a workforce shortage in the traditional sense. It is a systemic absence of care infrastructure that places the entire burden of mental health stabilization on frontline workers who are not trained, not compensated, and not supported to perform clinical functions. The result is a workforce that is simultaneously the first and last line of defense for America's most vulnerable citizens.
SECTION II: THE FINANCIAL & OPERATIONAL COST OF TURNOVER
Burnout as a Budget Line Item
2.1 The Turnover Epidemic
For approximately fifteen years prior to the COVID-19 pandemic, child welfare and human services turnover rates in the United States hovered between 20% and 40%, with an estimated national average of approximately 30% (Casey Family Programs, 2023). In comparison, annual turnover rates at or below 12% are considered optimal in the health care and human services sectors (Annie E. Casey Foundation, 2015).
The COVID-19 pandemic, labor market shifts, the national reckoning with racial injustice, and the youth mental health crisis have exacerbated these challenges. Post-pandemic data from multiple jurisdictions (Arizona, Colorado, Idaho, Missouri, Ohio) indicate that turnover rose further in 2020–2022 (Casey Family Programs, 2023).
The Children's Bureau (Administration for Children and Families) reports that annual turnover in child welfare agencies ranges from 30% to 60% in some jurisdictions, with excessive workloads and caseloads cited as primary drivers (Children's Bureau, 2023).
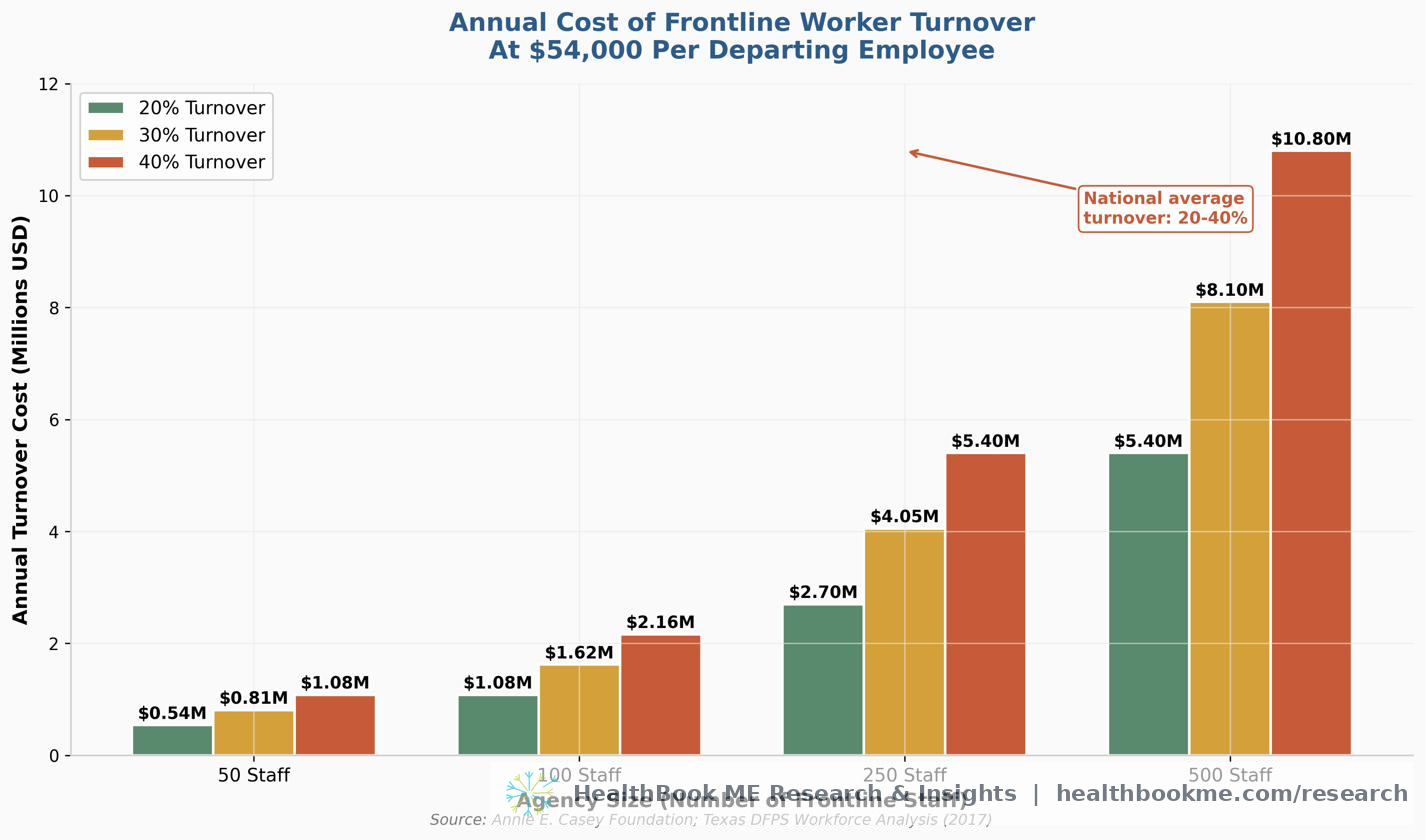
2.2 The $54,000 Price Tag
The Annie E. Casey Foundation, one of America's most respected child welfare research and policy organizations, has established the definitive cost figure for frontline caseworker turnover:
"Each exiting worker costs an agency around $54,000 to replace, which is equivalent to about 70 to 200% of an employee's salary." (Annie E. Casey Foundation, 2019)
This figure was validated by the Texas Department of Family and Protective Services, which estimated the agency cost at $54,000 per departing staff member (TexProtects, 2017). The cost components include:
Direct Costs: - Overtime for remaining staff covering vacant caseloads - Staff separation costs (exit interviews, administrative processing, benefits continuation) - Recruitment advertising and applicant screening - Background checks and credential verification - New hire training and onboarding - Shadowing and supervision during the probationary period
Indirect Costs: - Increased paperwork and case management burden on remaining staff - Emotional exhaustion and accelerated burnout among retained workers - Supervisors redirecting time from oversight to direct service provision - Loss of institutional knowledge and community relationships - Delayed permanency timelines for children in care - Increased risk of errors in safety assessments
Systemic Costs: - Failure to meet federal performance standards (e.g., CFSR outcomes) - Potential loss of federal Title IV-E funding - Reputational damage affecting future recruitment - Community distrust of the agency
2.3 The Compounding Effect
At a 100-person frontline agency with 30% annual turnover: - 30 staff departures per year - $1.62 million in direct replacement costs (30 × $54,000) - This does not include the indirect costs of overtime, supervisor diversion, or lost federal funding
At a 500-person agency with 30% turnover: - 150 staff departures per year - $8.1 million in direct replacement costs
These are not theoretical figures. They are line items that appear in agency budgets, grant reports, and state legislative appropriations. They represent resources that are not being spent on client services, prevention programs, or workforce support.
2.4 Why Workers Leave: The Predictors
A 2014 meta-analysis of turnover intention predictors among U.S. child welfare workers identified the factors with the highest effect on caseworkers' desire to leave:
- Stress and emotional exhaustion (highest effect)
- Organizational commitment (low commitment = high intent to leave)
- Job satisfaction (low satisfaction = high intent to leave)
More recent research has expanded this list to include: - Role ambiguity and unclear expectations - Low compensation relative to educational requirements and job demands - Toxic organizational culture - Lack of peer support and supervision - Increased administrative and documentation requirements - High caseloads and unmanageable workloads - Lack of community-based services to which clients can be referred - Exposure to family trauma compounded by the COVID-19 pandemic - Racial bias and discrimination within the workforce - Moral distress: Over 50% of caseworkers report not taking what they felt was the correct ethical action due to internal or external constraints; more than 40% say their job required them to do things against their better judgment (Casey Family Programs, 2023)
The COVID-19 pandemic added a new dimension: workers reported exhaustion and high levels of personal trauma compounded by the trauma they experienced as part of their job. However, some pandemic adaptations—particularly remote work—were viewed positively by workers, who reported increased productivity, reduced driving time, and better work-life balance (National Child Welfare Workforce Institute, 2021).
SECTION III: SECONDARY TRAUMATIC STRESS & PEER SPECIALIST TRIGGERS
The Hidden Occupational Hazard
3.1 Defining the Problem: Indirect Trauma Exposure (ITE)
Secondary traumatic stress (STS), also called vicarious traumatization, compassion fatigue, and burnout, is the umbrella term for negative psychological reactions that arise from indirect exposure to trauma (ITE)—hearing, reading about, or witnessing the traumatic experiences of others. While these concepts have been studied in clinical psychologists and emergency responders, they have received insufficient attention in the peer support and frontline human services workforce, where the risk may be even higher due to the relational intensity of the work and the lived experience of the workers themselves.
3.2 The Peer Specialist Dilemma: When Client Trauma Triggers Personal Trauma
A 2025 qualitative study published in Behavioral Sciences (Greene et al.) examined the experiences of 13 peer-support specialists—all of whom had their own histories of trauma and were now facilitating trauma-focused programming for military veterans and first responders. The findings provide the clearest evidence to date of how ITE triggers unprocessed personal trauma in workers with lived experience:
"Hearing these stories called on the stories that I hadn't thought about or processed myself and their grief or pain connected with my very real grief and pain." (Participant 6)
"Anything that had to do with having the innocence taken away from a child or like verbal and emotional abuse, abandonment, stuff like that. Because those were things that I had never really addressed. Maybe in like small doses… when I'd hear those things, it would just kind of take me into that place." (Participant 4)
The study documents that disclosures about abuse and sexual abuse—particularly involving women and children—were especially difficult:
"To see women that were violated in that way, it still hurts me." (Participant 6)
These are not isolated reactions. They represent a systemic occupational hazard for peer specialists, whose value proposition—their lived experience and ability to relate to clients—is simultaneously their greatest vulnerability. The very quality that makes them effective (authentic empathy born of shared experience) makes them susceptible to having their own trauma reactivated by client disclosures.
3.3 The Acclimation Period: Early-Career Distress
The study identified a distinct "acclimation period" during the initial months and years of peer support work, characterized by intense and frequent distressing internal responses:
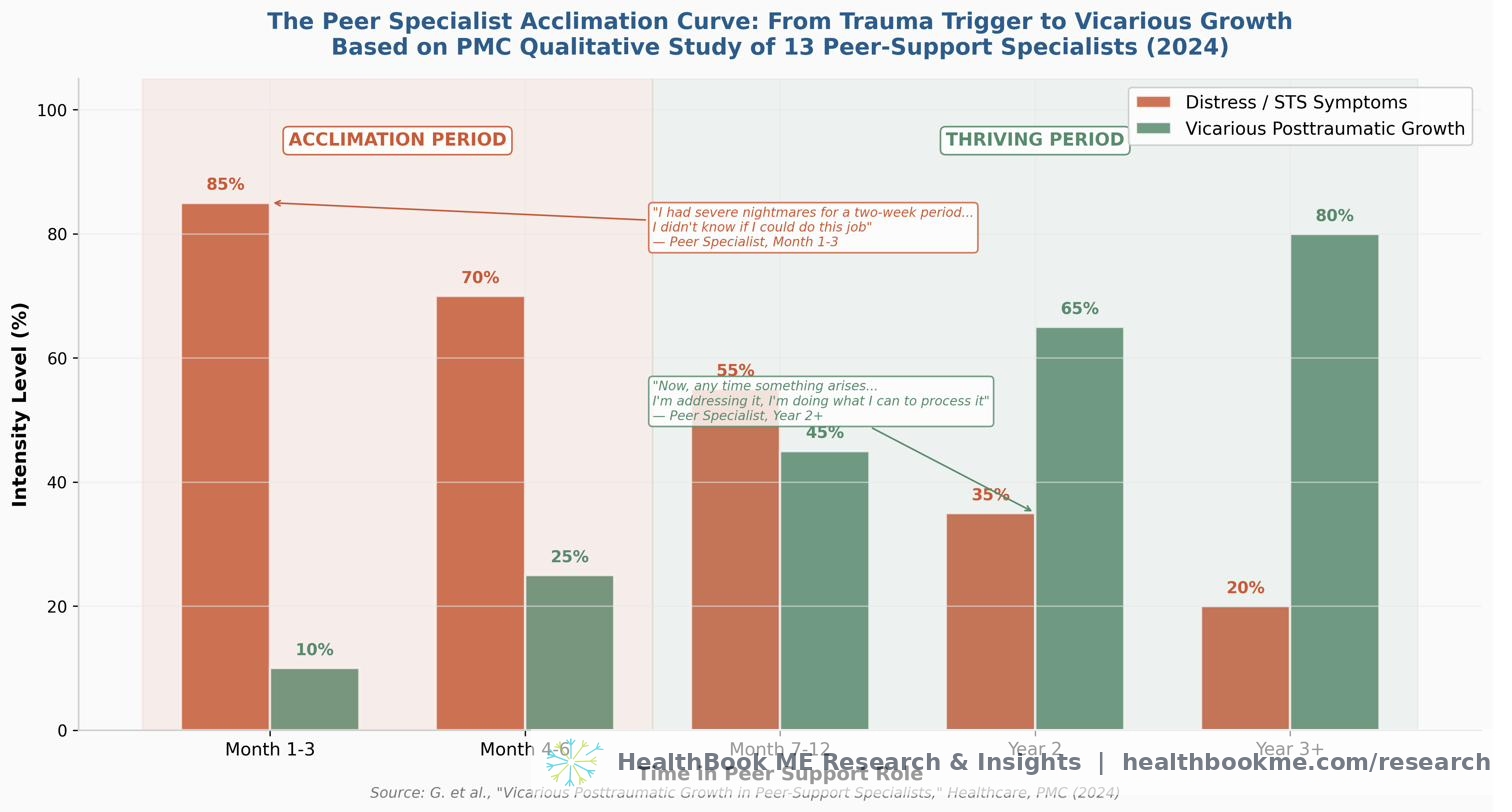
Emotional Distress: - Increased heart rate and anxiety - Flashbacks to personal trauma - Sadness and depression - Trouble sleeping and nightmares
"I had a set of severe nightmares that happened for a two-week period… it was like this two-week period where I was like, 'Oh my God. I don't know if I can do this job if this is what was going to happen.'" (Participant 1)
"So there has been a few times during the struggle portion where I kind of found myself zoning off in their story and started reflecting on my own. One of them even brought back the smells, because that's all he was talking about. And it took me a couple of days to stop thinking about it to where I wasn't actually smelling those smells again." (Participant 10)
Intrusive Rumination: - Unwanted thoughts about client stories - Memories of personal trauma resurfacing after years of dormancy
"It would trigger memories of events that I either hadn't thought of for years and years… I was having intrusive thoughts. It was taking me back to times and places that I didn't want to revisit." (Participant 1)
Moral Challenges to Core Beliefs: - Shifts in worldview about the nature of humanity and society - Existential distress about systemic failures
"It became, I would say, morally challenging… So I shifted from this, 'Holy sh*t. I can't believe I'm hearing this. I feel so bad for this person.' And then it became, 'Wow, what's really going on in the world?'" (Participant 5)
The study notes that these responses were "particularly intense and frequent during initial months and years of working with trauma survivors" and that several participants described these early experiences as "overwhelming and, at times, destabilizing."
3.4 Quantitative Evidence: PTSD Rates in Frontline Human Services
While the qualitative study above focused on peer specialists, quantitative research on broader frontline human services populations confirms that these trauma responses are not limited to peer workers. Studies of U.S. frontline staff in housing, homelessness, and shelter settings document PTSD-level symptoms at rates comparable to or exceeding those of emergency responders:
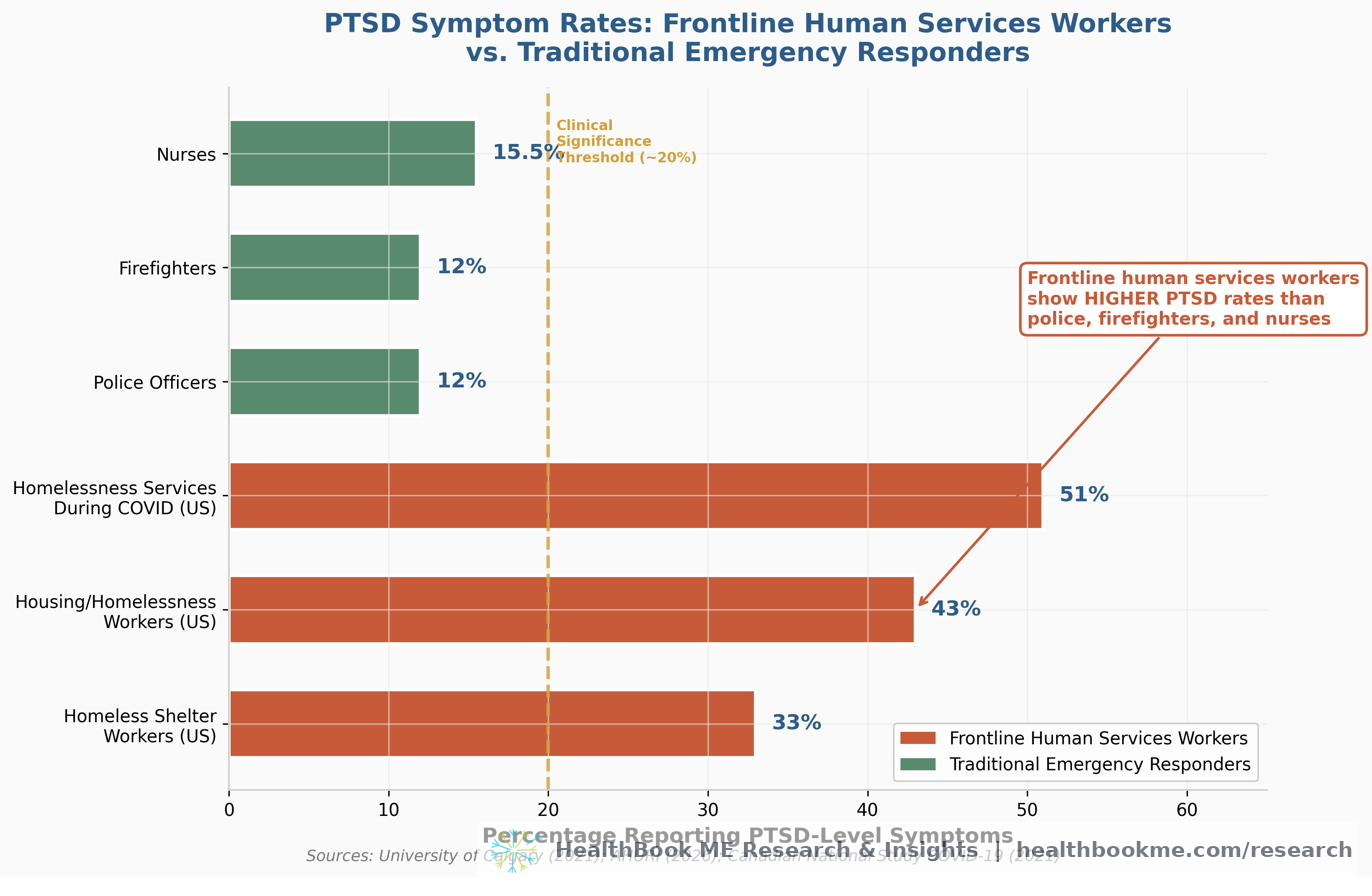
Homeless Shelter Workers (U.S. — Schiff & Lane, Community Mental Health Journal, 2019; 472 frontline workers across 23 organizations): - 33% experienced symptoms of PTSD - This is significantly higher than police (10–14%), firefighters (10–14%), and nurses (14–17%) - Rates of burnout and vicarious traumatization were comparable to workers in other social-services organizations, but PTSD-symptom rates were notably elevated
Housing and Homelessness Frontline Staff (Australia — AHURI Final Report No. 455, 2026; national survey of 578 frontline staff): - 90% reported moderate-to-high vicarious trauma - 61% reported symptoms of burnout - 43% reported PTSD symptoms warranting further clinical assessment - Rates of significant PTSD symptoms were higher than among Australian emergency service workers. (Included as international comparison; the convergence with U.S. findings strengthens the pattern but this is not U.S. data.)
National Study During COVID-19 (Canada — Waegemakers Schiff et al., Journal of Occupational and Environmental Medicine, 2024; national survey, n = 574 across seven Canadian cities): - 51% of homelessness services frontline workers had post-traumatic stress symptoms (PTSS) - Case managers and client care coordinators reported the highest average PTSD scores (15.0) and burnout scores (25.25) - The study concluded: "The threat of workplace psychological injury is more pervasive than that experienced by emergency services workers" (Included as international comparison; like the AHURI data above, this is Canadian, not U.S. — the convergence across three countries strengthens the pattern.)
The U.S. figure that anchors this section is Schiff & Lane's 33% (homeless-shelter workers, Community Mental Health Journal, 2019). The Australian (AHURI, 43%) and Canadian (Waegemakers Schiff et al., 51%) findings are included as clearly-labeled international comparisons. The convergence across three countries—each showing frontline human services PTSD rates well above those of traditional emergency responders—is what makes the pattern robust, not any single national figure.
3.5 The Compounding Factor: No Behavioral Health Safety Net for Workers
The cruel irony of this data is that the same workers experiencing PTSD-level symptoms from their jobs are themselves living in the same Mental Health HPSAs as their clients. When a peer specialist or caseworker needs trauma-informed therapy, they face the same 48-day average wait time, the same insurance barriers, and the same provider shortages as the people they serve. There is no occupational health infrastructure for frontline human services workers in the United States. Workers are expected to self-regulate, self-care, and self-heal—often while managing caseloads that would break a clinician.
SECTION IV: HIGH CASELOAD IMPACT ON CLIENT OUTCOMES
The Mathematical Proof of Failure
4.1 The Causal Chain: From Caseload to Client Harm
The evidence for a direct causal relationship between high caseloads and negative client outcomes is robust, multi-jurisdictional, and spans child welfare, housing, and criminal justice contexts. The mechanism is straightforward:
High Caseloads → Reduced Worker-Client Contact → Diminished Assessment & Engagement → Safety Failures & Placement Disruption → Worker Burnout & Turnover → Relationship Loss for Client → Re-entry into Care or System
Casey Family Programs (2023) summarizes the research consensus:
"High staff turnover has been associated with more placement disruptions, time in foster care, incidents of maltreatment, and re-entries into foster care. Research suggests that caseworker turnover is frequent, often abrupt, and constitutes a relationship loss with children that has complex and negative impacts on children's well-being."
The Children's Bureau (ACF) confirms the mechanism:
"High caseloads and workloads impact caseworkers' levels of stress, feelings of emotional exhaustion, and job satisfaction. They also impact key casework functions, such as timeliness, continuity, quality of service delivery, family engagement, and relationship-building." (Children's Bureau, 2023)
4.2 The Delaware Time Study: Quantifying the Contact Gap
The Delaware Child Protection Accountability Commission conducted a comprehensive time study in 2018 that provides the most precise quantification of how caseloads destroy worker-client contact. The study examined treatment workers with an average caseload of 17 cases (serving 34 children):
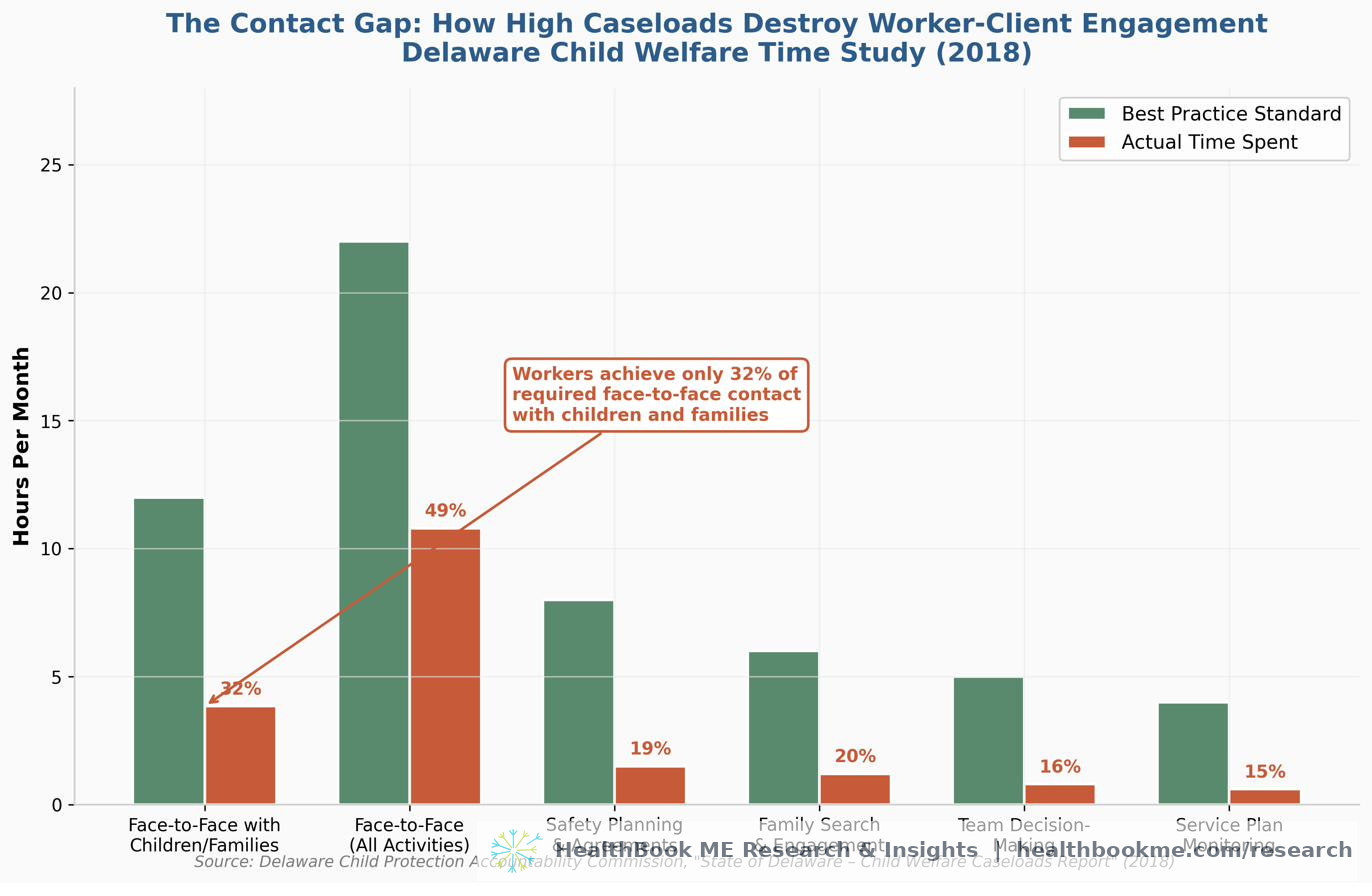
| Activity | Estimated Best-Practice Time | Actual Time Spent | Percent Achieved |
|---|---|---|---|
| Face-to-Face Contacts with Children/Families | 12 hours/month | 3.84 hours/month | 32% |
| Total Face-to-Face Time (All Activities) | 22 hours/month | 10.8 hours/month | 49% |
Source: Delaware Child Protection Accountability Commission, "State of Delaware – Child Welfare Caseloads Report" (2018).
The study explicitly states the consequences:
"Not having enough time to engage in meaningful and frequent contacts with clients and parties associated to the cases compromises a worker's ability to accurately assess and ensure safety of the children. It further impacts their ability to engage the family, care providers and others in goal planning and ongoing assessment of needs and strengths, as well as progression on service plans."
Workers spent the least amount of time on best-practice activities including: - Family search and engagement - Safety planning and agreements - Team decision-making - Ongoing assessment of needs and strengths - Service plan progression monitoring
These are not optional activities. They are the core functions that determine whether a child is safe, whether a family is stabilized, and whether a client achieves permanency or housing stability.
4.3 The Caseload Standard Gap
The Child Welfare League of America (CWLA) recommends no more than 15 cases per worker for child welfare. National averages, however, range from 24 to 31 children per worker, with some workers handling 50 to 80 cases (SDSU Academy for Professional Excellence, 2021). The median caseworker handles 55 cases annually and stays on the job only about 1.8 years.
This means that by the time a worker has developed the expertise, community relationships, and institutional knowledge to be effective, they have already left. The client experiences not a continuous therapeutic relationship but a series of brief, interrupted contacts with a rotating cast of overwhelmed novices.
4.4 Impact on Housing Retention and Recidivism
The housing and homelessness literature provides parallel evidence. Stable housing is one of the strongest predictors of reduced criminal recidivism. Washington State's Reentry Housing Pilot Program found that periods of homelessness significantly elevated the risk of recidivism, with stable accommodation producing lower rates of new convictions and readmissions to custody (Washington State Department of Corrections, 2015).
When housing caseworkers are overwhelmed—managing 90+ cases, as documented in some jurisdictions—clients lose housing support, miss appointments, fail to complete service plans, and cycle back into homelessness. The domino effect is measurable in: - Increased emergency shelter utilization - Higher rates of housing re-entry - Elevated recidivism rates for justice-involved clients - Increased emergency department visits - Higher costs to Medicaid, corrections, and social services systems
A 2024 study by Rhoades et al. in Child Abuse & Neglect found that case complexity and percentage of clients in high-risk fields were the strongest predictors of unfavorable treatment outcomes in family advocacy programs, confirming that unmanageable caseloads directly degrade client results across service domains (Rhoades et al., 2024).
SECTION V: THE INTERSECTION — HOW THE FOUR FORCES COLLIDE
The four pillars documented in this whitepaper do not operate in isolation. They are interconnected feedback loops that amplify each other:
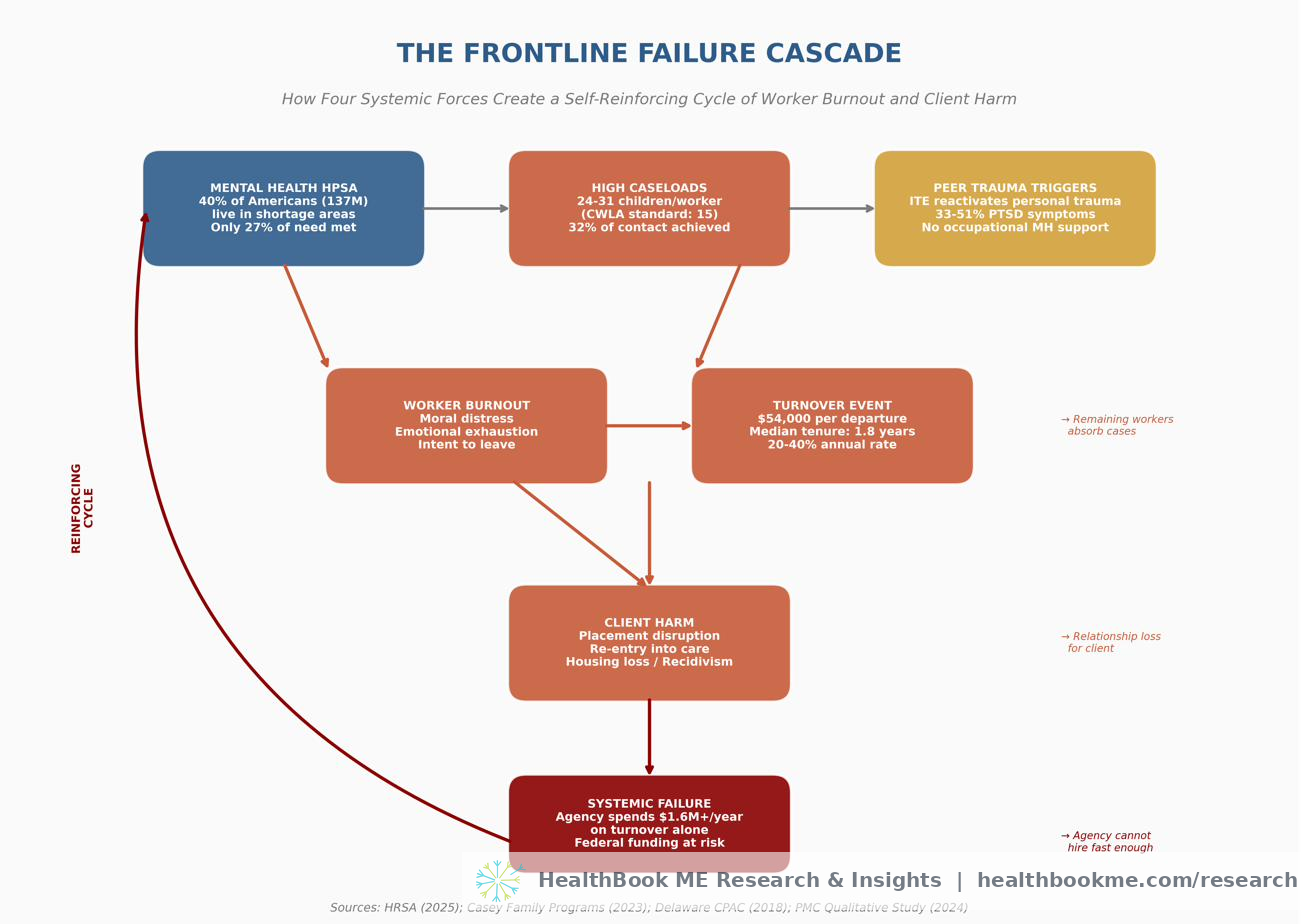
Consider the experience of a typical frontline caseworker in the United States in 2026:
-
She lives in a Mental Health HPSA (40% chance). When she needs therapy for the trauma she absorbs from her clients, the wait is 48+ days, and there may be no provider within a reasonable distance.
-
Her caseload is 24–31 children (national average), double the CWLA standard. She achieves face-to-face contact with her clients only 32% of the time required for best practice. She cannot assess safety adequately, cannot engage families meaningfully, and cannot monitor service plan progression.
-
She is a peer specialist with lived experience (increasingly common in modern human services). Her clients' trauma stories trigger her own unprocessed trauma. She experiences nightmares, intrusive thoughts, and moral distress. She has no occupational mental health support.
-
She burns out and leaves within 1.8 years (median tenure). Her departure costs the agency $54,000. The children on her caseload experience a relationship loss that research associates with placement disruption and re-entry into care. Her remaining colleagues absorb her cases, accelerating their own burnout.
-
The cycle repeats. The agency spends $1.6+ million annually on turnover. The clients receive fragmented, substandard care. The system fails both the workers and the vulnerable people it exists to serve.
This is not a failure of individual workers. It is a structural failure of a system that has been underfunded, understaffed, and unsupported for decades.
SECTION VI: RECOMMENDATIONS FOR FUNDERS AND AGENCY DIRECTORS
Based on the evidence presented in this whitepaper, the following recommendations are offered for grant funders, agency directors, and policy makers:
6.1 Fund Workforce Retention, Not Just Recruitment
The data is clear: agencies are spending $54,000 per departing worker on replacement while failing to invest in the conditions that would keep workers. Funders should prioritize: - Competitive compensation that reflects the educational requirements and emotional demands of the work - Clinical supervision that is regular, trauma-informed, and mandatory—not optional - Caseload caps enforced through grant conditions and state licensing requirements - Peer support programs for workers, not just for clients - Mental health benefits that include same-week access to trauma-informed therapy
6.2 Invest in the Behavioral Health Workforce Pipeline
With 137 million Americans in Mental Health HPSAs and projected shortages of 30–70% across professions by 2038, the pipeline crisis is existential. Funders should support: - Loan repayment programs for behavioral health providers who serve in HPSAs - Scope of practice harmonization to allow providers to practice across state lines and via telehealth - Peer specialist training and certification with embedded trauma support - Integrated care models that embed behavioral health in primary care and human services settings
6.3 Mandate and Fund Trauma-Informed Organizational Practices
With 33–51% of frontline workers experiencing PTSD-level symptoms, trauma exposure is not an individual weakness—it is an occupational hazard. Agencies should be required to: - Screen workers for secondary traumatic stress at regular intervals - Provide trauma-informed therapy as an occupational health benefit - Implement caseload weighting systems that account for case complexity and trauma exposure - Create "recovery time" protocols following high-trauma cases (analogous to debriefing for first responders) - Train supervisors to recognize STS symptoms and intervene before burnout becomes turnover
6.4 Measure What Matters
Agencies and funders should track metrics that reflect the intersection of workforce health and client outcomes: - Worker-client contact ratio (actual vs. best-practice) - Worker tenure and turnover rate by role, supervisor, and unit - STS screening scores (not just self-reported burnout) - Client placement stability and re-entry rates correlated with worker turnover - Cost per successful client outcome (not just cost per client served)
6.5 Recognize That Peer Specialists Are a High-Need Workforce
Peer specialists with lived experience are uniquely effective and uniquely vulnerable. Funders should: - Require trauma-informed supervision specifically designed for peer workers - Fund peer specialist support groups facilitated by clinicians - Provide clear career ladders that do not require peer workers to absorb increasing trauma exposure to advance - Compensate peer specialists at rates commensurate with their value and their risk
REFERENCES
Annie E. Casey Foundation. (2015). 10 Practices: A Child Welfare Leader's Desk Guide to Building a High-Performing Agency. Baltimore, MD: Annie E. Casey Foundation.
Australian Housing and Urban Research Institute (AHURI). (2026). Workplace trauma on the social housing and homelessness frontline (AHURI Final Report No. 455). Melbourne: AHURI. https://www.ahuri.edu.au/research/final-reports/455 (International comparison source.)
Annie E. Casey Foundation. (2019, March 4). Top causes of staff turnover at child welfare agencies and what to do about it. Annie E. Casey Foundation Blog. https://www.aecf.org/blog/top-causes-of-staff-turnover-at-child-welfare-agencies-and-what-to-do-about
Andrilla, C. H. A., Woolcock, S. C., Garberson, L. A., & Patterson, D. G. (2022a, 2022b, 2022c, 2022d). Changes in the supply and rural-urban distribution of psychiatric nurse practitioners, psychologists, social workers, and counselors in the U.S., 2014-2021. WWAMI Rural Health Research Center, University of Washington.
Casey Family Programs. (2023, August 29). How does turnover in the child welfare workforce impact children and families? Casey Family Programs. https://www.casey.org/turnover-costs-and-retention-strategies/
Children's Bureau. (2023). Child welfare workforce data and reports. Administration for Children and Families, U.S. Department of Health and Human Services.
Delaware Child Protection Accountability Commission. (2018). State of Delaware – Child Welfare Caseloads Report. Dover, DE: Delaware Courts. https://courts.delaware.gov/forms/download.aspx?id=119998
Greene, T. C., Rhodes, J. R., Renner-Wilms, S., Tedeschi, R. G., Moore, B. A., & Elkins, G. R. (2025). Vicarious posttraumatic growth in peer-support specialists: An interpretive phenomenological analysis. Behavioral Sciences, 15(12), 1673. https://doi.org/10.3390/bs15121673
Health Resources and Services Administration (HRSA). (2025a, December). State of the Behavioral Health Workforce, 2025. National Center for Health Workforce Analysis, Bureau of Health Workforce. https://bhw.hrsa.gov/sites/default/files/bureau-health-workforce/data-research/Behavioral-Health-Workforce-Brief-2025.pdf
Health Resources and Services Administration (HRSA). (2025b, December 11). Designated Health Professional Shortage Areas Statistics: Fourth Quarter of Fiscal Year 2025. Bureau of Health Workforce. https://data.hrsa.gov/default/generatehpsaquarterlyreport
Kim, H., & Kao, D. (2014). A meta-analysis of turnover intention predictors among US child welfare workers. Children & Youth Services Review, 47, 214–223.
National Center for Health Workforce Analysis. (2025). Health Workforce Simulation Model (HWSM) projections. HRSA. https://data.hrsa.gov/topics/health-workforce/nchwa/workforce-projections
National Child Welfare Workforce Institute. (2021). COVID-19 Workforce Needs Assessment. https://www.ncwwi.org/
National Council for Mental Wellbeing. (2023). The behavioral health workforce: Shortages, burnout, and solutions. Washington, DC.
Rhoades, K. A., Brown, J. A., & Hurley, K. D. (2024). Caseload factors predictive of family abuse and neglect treatment outcomes. Child Abuse & Neglect, 153, 107172. https://doi.org/10.1016/j.chiabu.2024.107172
Schiff, J. W., & Lane, A. M. (2019). PTSD symptoms, vicarious traumatization, and burnout in front line workers in the homeless sector. Community Mental Health Journal, 55(3), 454–462. https://doi.org/10.1007/s10597-018-00364-7
SDSU Academy for Professional Excellence. (2021). Research Summary: Caseload Standards & Weighting. San Diego State University. https://theacademy.sdsu.edu/wp-content/uploads/2021/10/CWDS-Research-Summary_Caseload-Standards-and-Weighting.pdf
Substance Abuse and Mental Health Services Administration (SAMHSA). (2025). National Survey on Drug Use and Health (NSDUH) 2024. Rockville, MD: SAMHSA.
TexProtects. (2017, January). Child Protective Services Workforce Analysis and Recommendations. Austin, TX.
Waegemakers Schiff, J., Weissman, E., Schiff, R., Liu, J., Pitoulis, T., & Jones, A. (2024). Increase in trauma leading to psychological injury among Canadian homelessness services workers during the COVID-19 pandemic. Journal of Occupational and Environmental Medicine, 66(1), 71–77. https://doi.org/10.1097/JOM.0000000000002996 (International comparison source — Canada.)
Washington State Department of Corrections. (2015). Reentry Housing Pilot Program: Final Report. Olympia, WA.
This whitepaper was prepared primarily using U.S. federal data, U.S. academic research, and U.S. policy organization reports, supplemented by clearly labeled international studies where comparable U.S. data on frontline-worker trauma is limited. All statistics are current as of 2025–2026 and are suitable for citation in grant applications, legislative testimony, and policy briefs.
For questions or additional data requests, contact the research team.
Get in touch
Follow this research
More policy briefs and field research are in progress. For partnership, press, or research inquiries in the meantime, we’d be glad to hear from you.